SendLucidSendLucid Docs
SendLucid
  • Introduction
    • Overview
    • Run Your First Test
    • Connect Your Platform
    • Read Your First Report
    • Your Dashboard
    • Overview
    • Email Deliverability
    • The Deliverability Score
    • The Analytics Data Model
    • Revenue Attribution
    • Lifetime Value (LTV)
    • Engagement & Fatigue
    • Finding Opportunities
    • Overview
    • Authentication Checks
    • Blacklist & Reputation Checks
    • Content & HTML Checks
    • Infrastructure Checks
    • Test History
    • Campaign Reviews
    • Score Trends
    • Reports
    • Executive Summary
    • Campaigns
    • Deliverability
    • Flows
    • Send Times
    • Subscribers
    • Acquisition
    • Attribution
    • Lifetime Value
    • Fatigue
    • Content & Angles
    • Benchmarks
    • Alerts
    • Integrations
    • Domains
    • Team
    • API Keys
    • Billing & Plans
    • Overview
    • SPF Checker
    • DKIM Checker
    • DMARC Checker
    • BIMI Inspector
    • Blacklist Checker
    • MX Lookup
    • Header Analyzer

On This Page

  • What you see
  • How to read it
  • Related
Question? Give us feedback →Edit this page
Deliverability TestingScore Trends

Score Trends

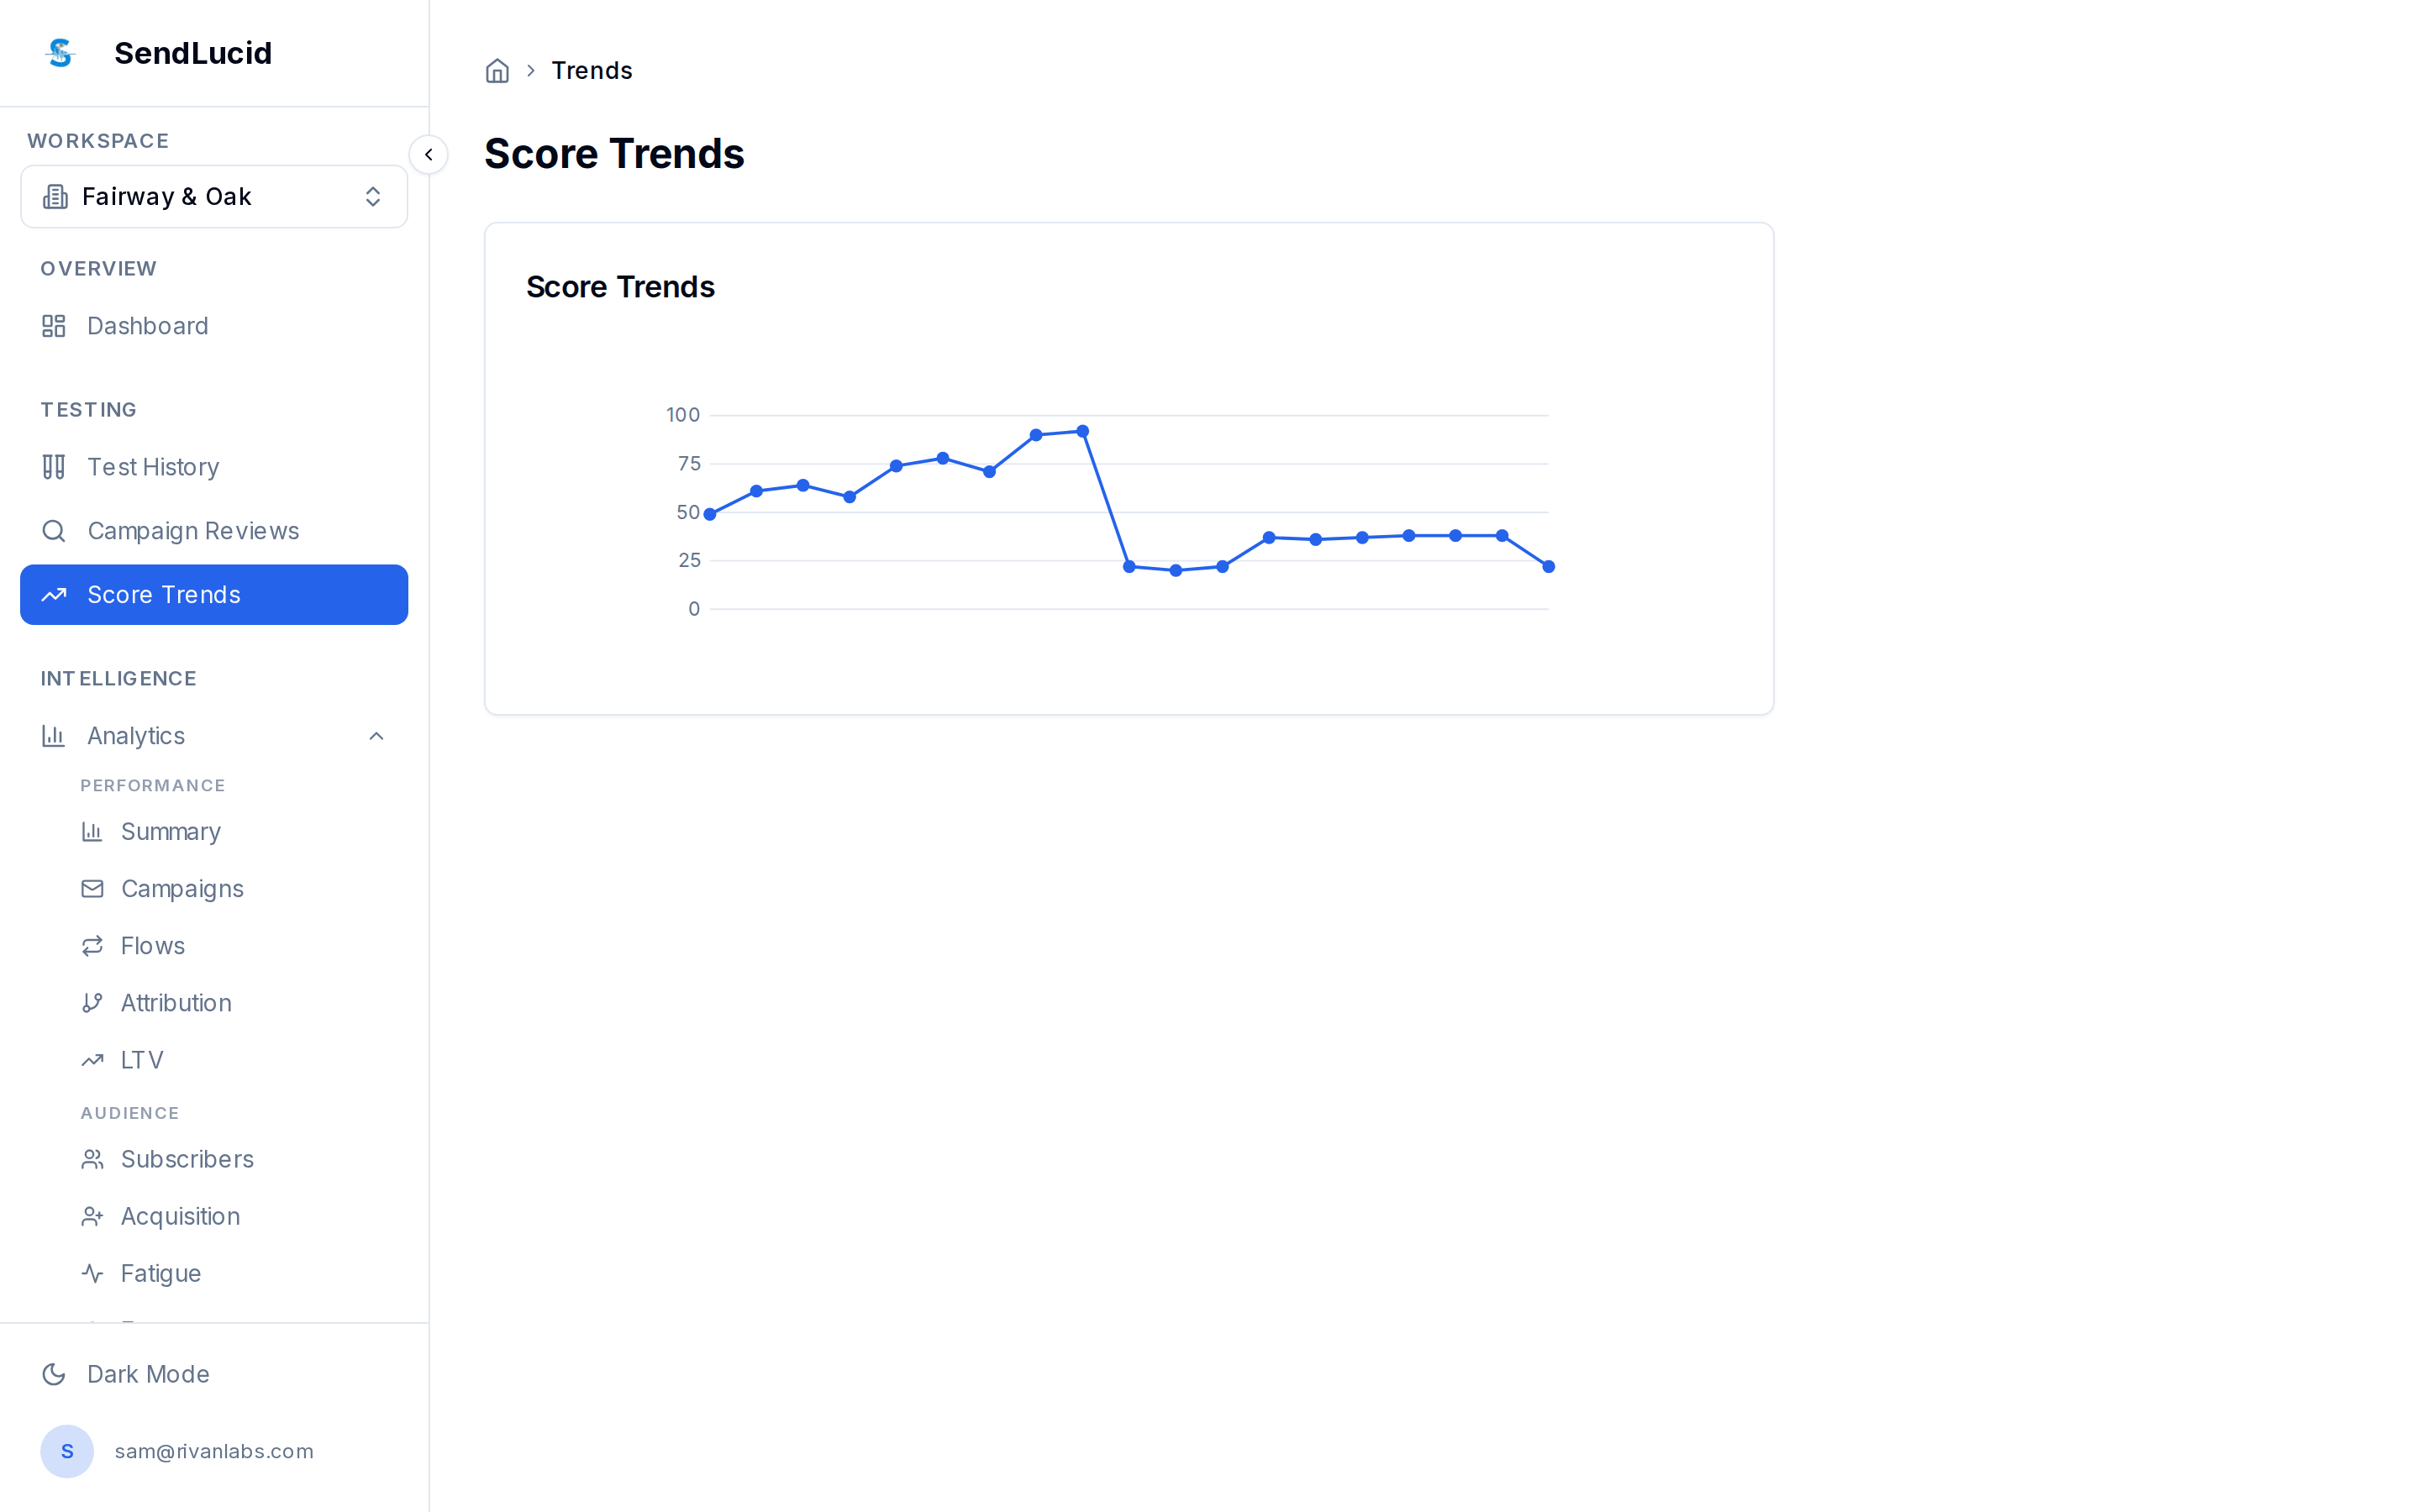
Your deliverability score plotted over time, so a slow decline shows up before it costs you.
SendLucid Score Trends

What you see

  • A line chart of your score across tests, broken out by sending domain.

How to read it

A downward slope means something regressed — often an authentication or reputation change. Cross-reference with Test History to find the exact test where it dropped, then open that report.

Related

  • Test History · The Deliverability Score · Deliverability
Campaign ReviewsReports

MIT 2026 © Nextra.