Campaigns
Every campaign you’ve sent, ranked by the revenue it drove. This is where you see what’s actually working — and copy it.
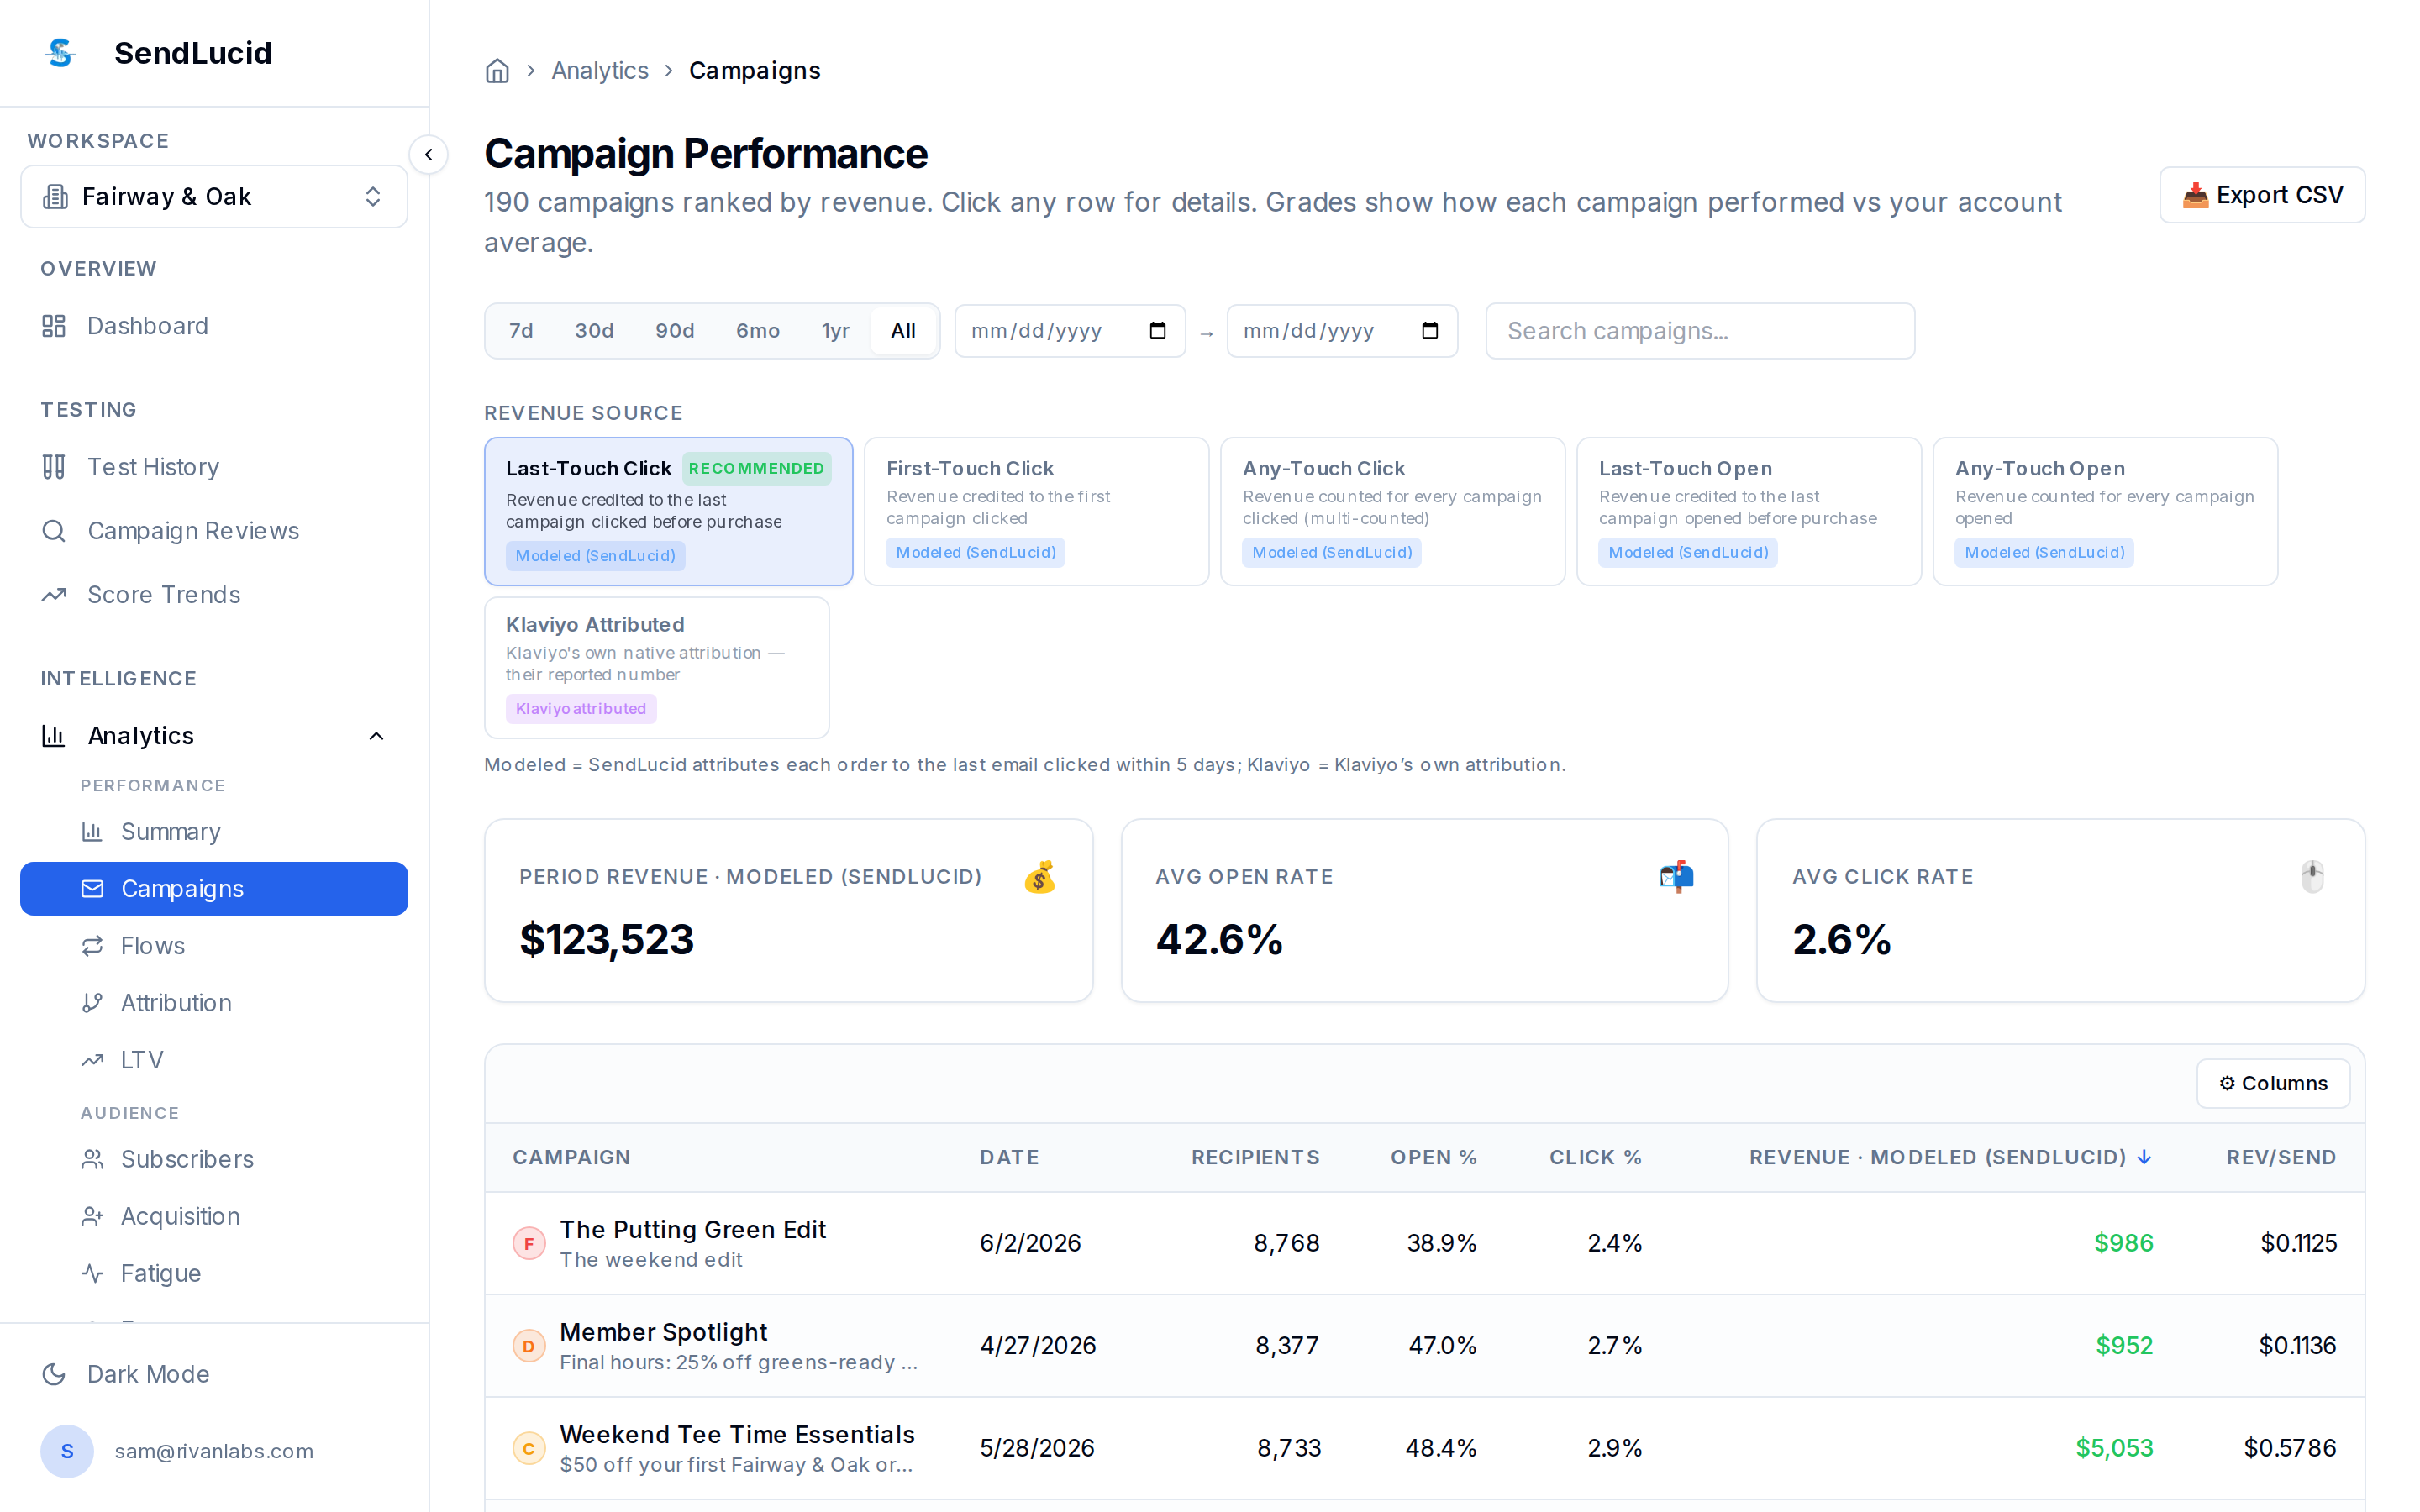
What you see
- Revenue source (attribution model) — switch between Last-Touch Click (recommended), First-Touch, Any-Touch, open-based models, and your ESP’s own attribution. See Revenue Attribution for what each means.
- Period KPIs — modeled revenue, average open rate, average click rate.
- Campaign table — every campaign with date, recipients, open %, click %, modeled revenue, and revenue per send (Rev/Send). Sort by any column; click a row for detail.
How to read it
Sort by Rev/Send, not just total revenue — it normalizes for list size and reveals which types of campaigns punch above their weight. Compare your top rows against your average to see what to repeat.
What to do
Find the patterns in your best campaigns (offer, subject angle, timing) and apply them to upcoming sends. Use Export CSV to share or analyze further.