Benchmarks
How do you stack up? This page compares your key metrics to industry averages, so you know whether a number is genuinely good or just feels good.
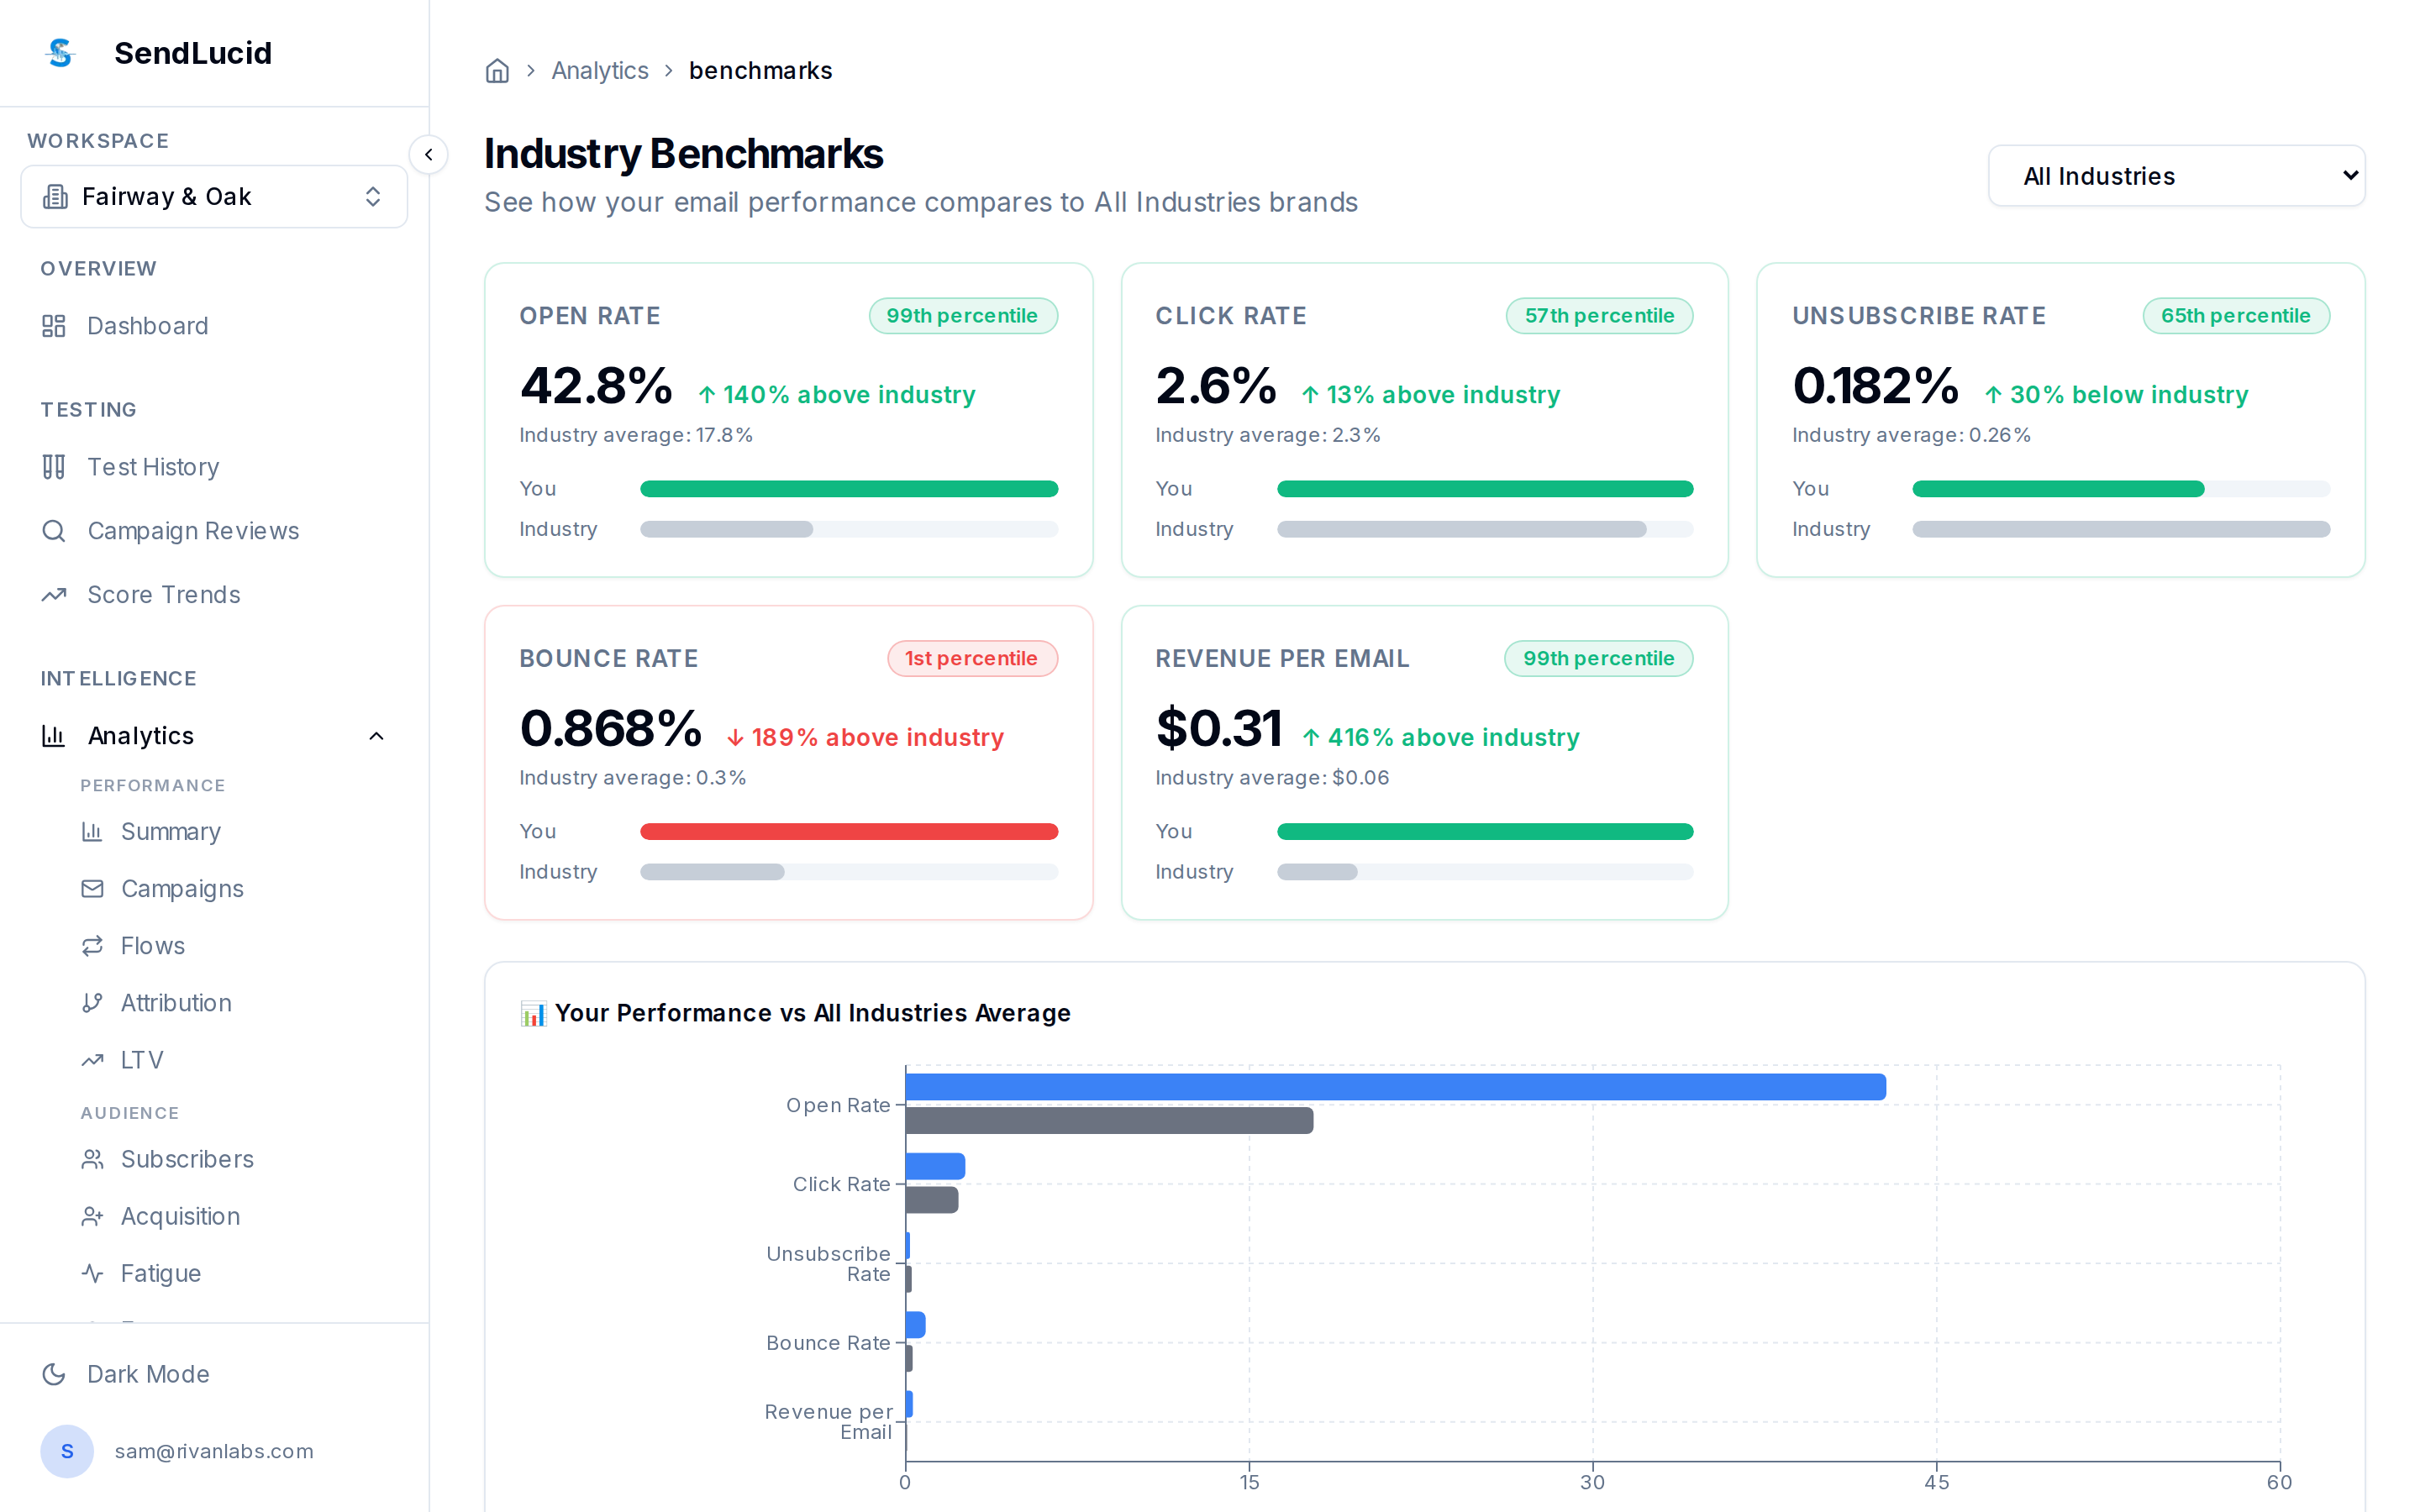
What you see
- Metric cards — open rate, click rate, unsubscribe rate, bounce rate, and revenue per email, each showing your value, the industry average, your percentile, and the gap (e.g. “Open Rate 42.8% — 99th percentile, 140% above industry”).
- You vs. Industry — a side-by-side bar chart across all the metrics.
How to read it
Percentile is the real signal. A metric can look fine in isolation but sit in a low percentile — that’s where to focus. Watch the “bad” metrics especially: a bounce rate in the 1st percentile (worse than 99% of senders) is a flashing red light even if every other number is strong.
What to do
Pick your weakest percentile and treat it as the priority. Benchmarks tell you where you’re behind; the action items tell you what to do about it.