Lifetime Value
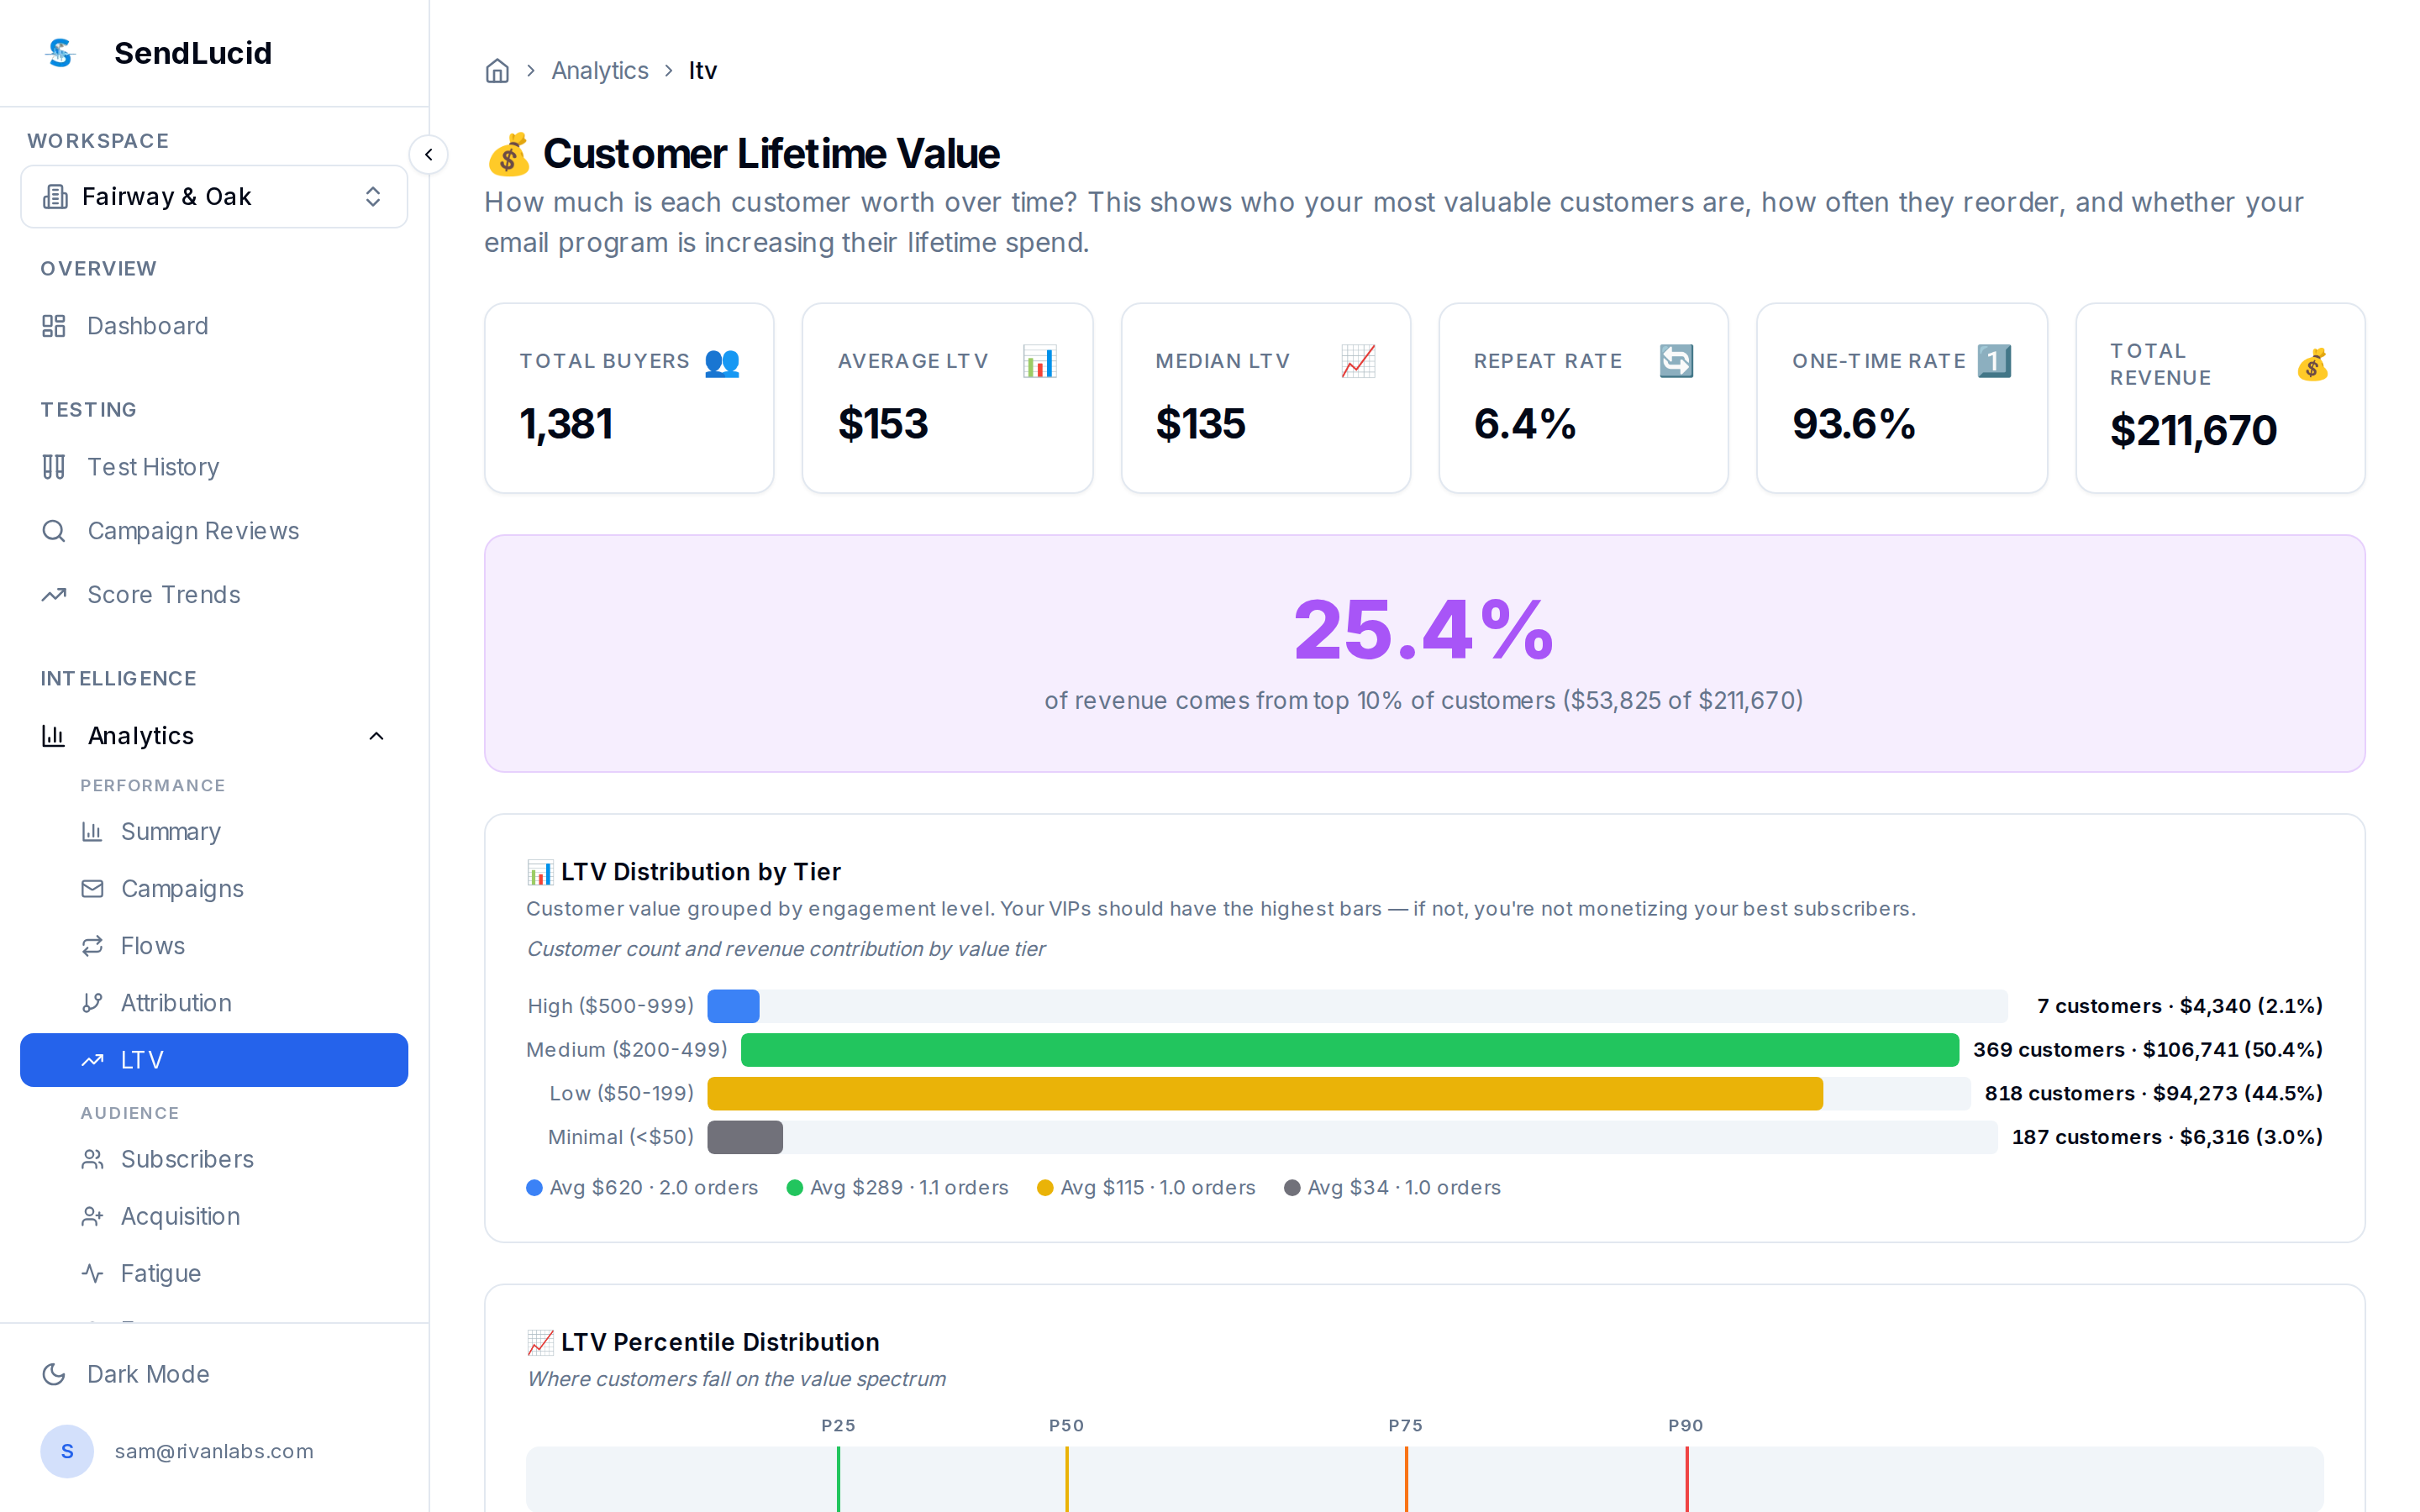
How much is each customer worth over time? This page shows who your most valuable customers are, how often they reorder, and whether email is growing their lifetime spend.
What you see
- Headline KPIs — total buyers, average LTV, median LTV, repeat rate, one-time rate, and total revenue.
- Revenue concentration — what share of revenue comes from your top 10% of customers (e.g. “25.4% of revenue from the top 10% ($53,825 of $211,670)”).
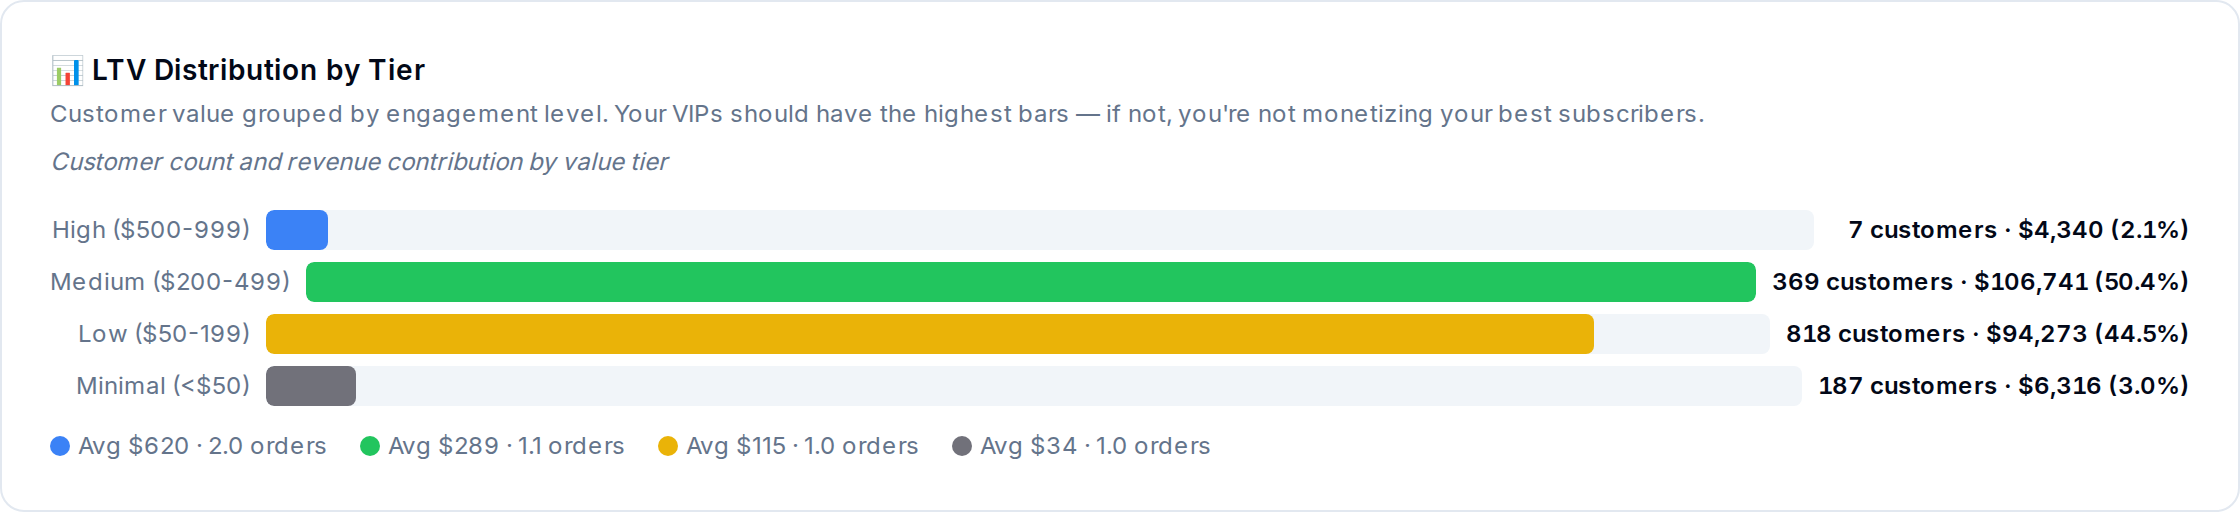
- LTV Distribution by Tier — customers grouped by value (High / Medium / Low / Minimal), with count and revenue contribution.
- LTV Percentile Distribution — where customers fall on the value spectrum.
Per-stat breakdown
Headline KPIs

LTV Distribution by Tier
LTV Percentile Distribution

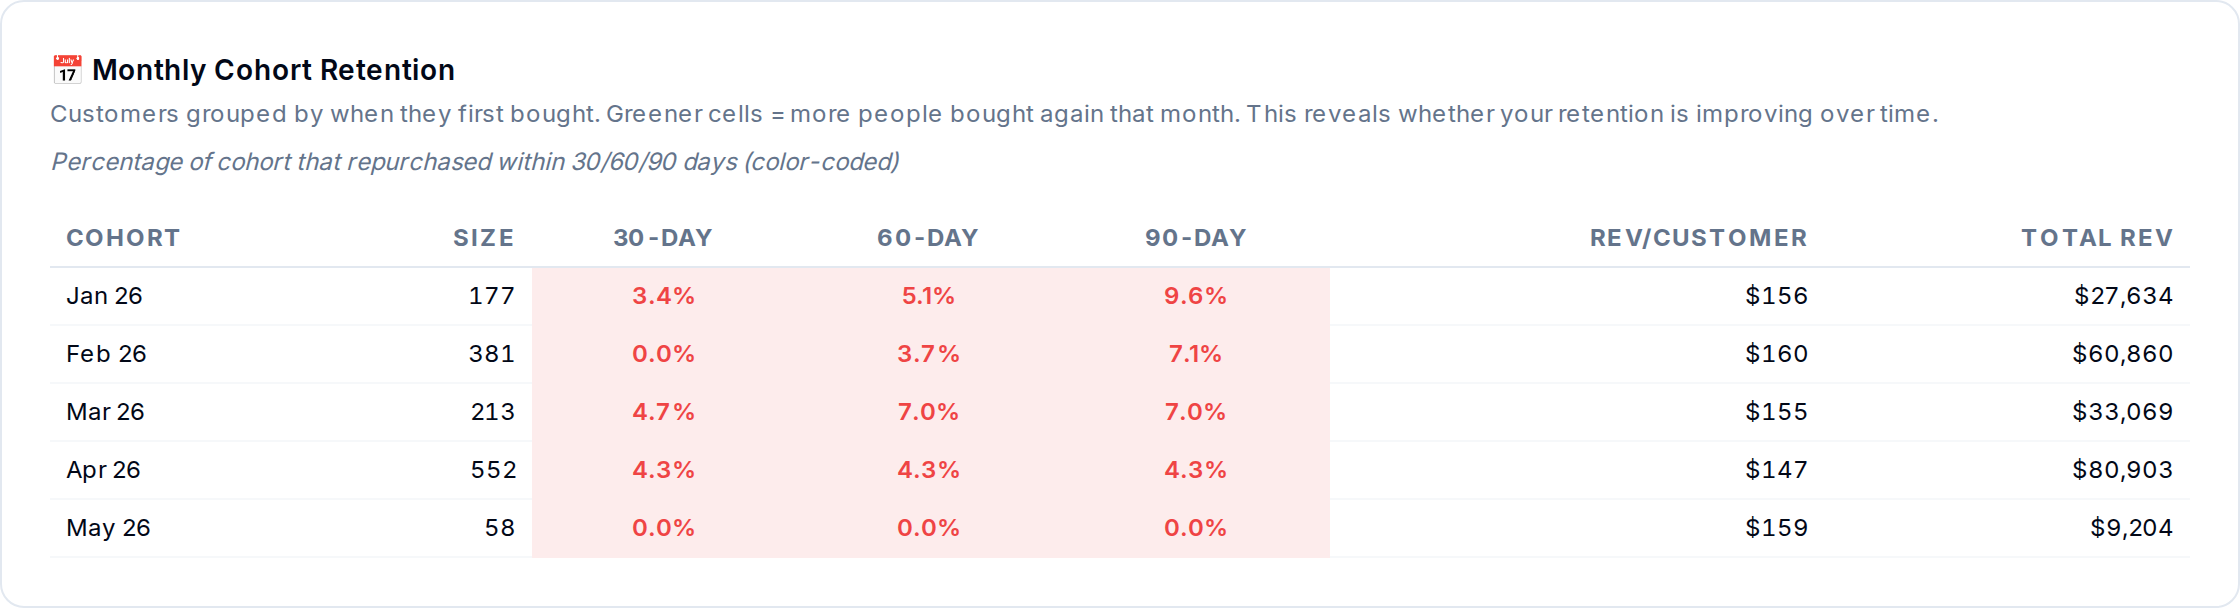
Monthly Cohort Retention
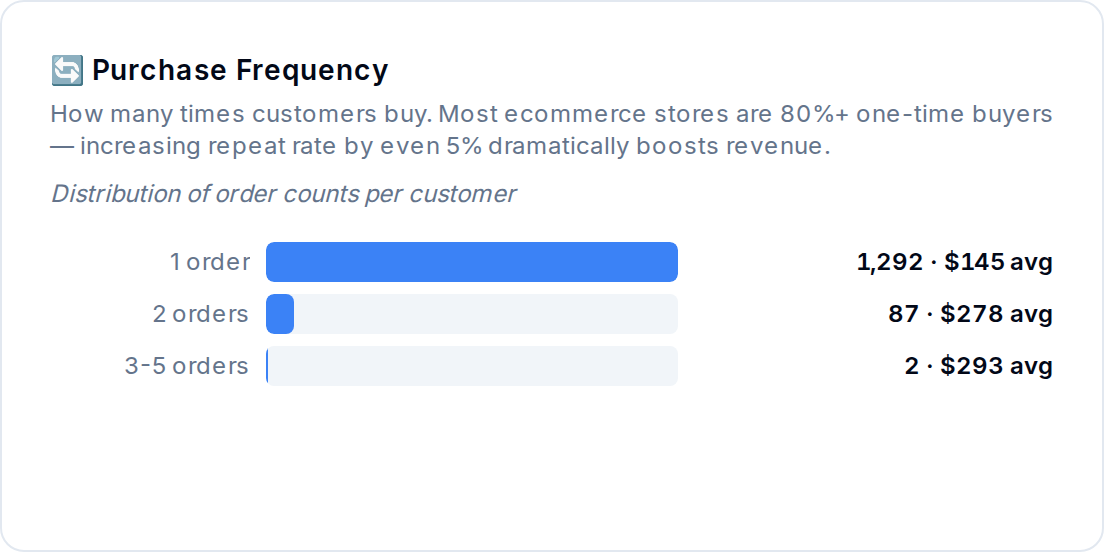
Purchase Frequency
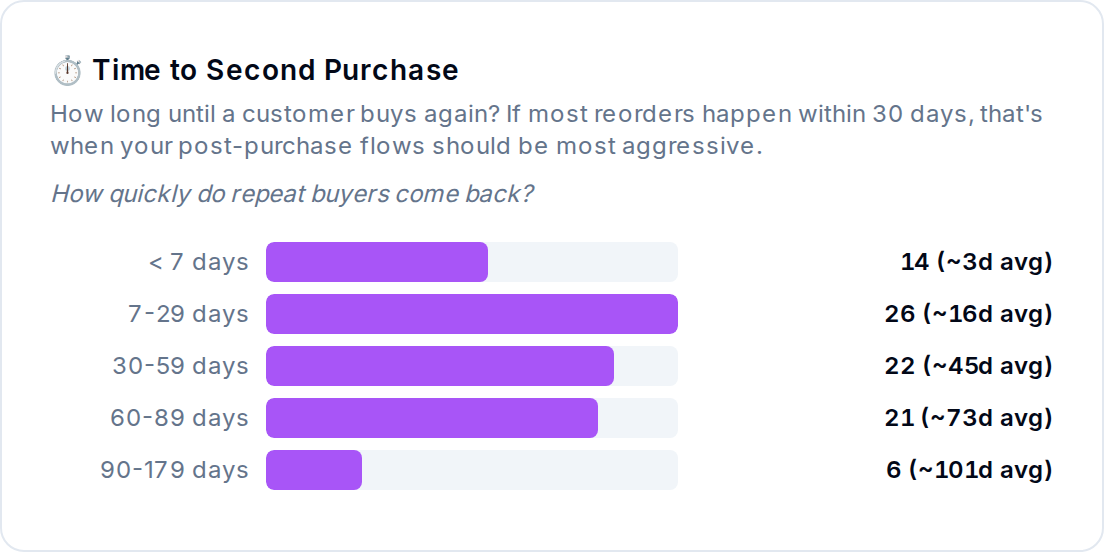
Time to Second Purchase
Email Impact on LTV

How to read it
A high one-time rate with a low repeat rate means you’re acquiring but not retaining — a flows-and-retention problem. Heavy revenue concentration in the top tier means your VIPs matter enormously; make sure they’re not being under-mailed.
What to do
Build retention for one-time buyers (post-purchase, replenishment flows), and give high-LTV customers dedicated attention. See Lifetime Value (concept).